National Convenience Store Benchmark Report: What CPG Brands Are Missing

National Convenience Store Benchmark Report: What CPG Brands Are Missing

National Convenience Store Benchmark Report: What CPG Brands Are Missing

Retail strategy is often won or lost at the shelf.

Brands invest millions in promotions, pricing strategies, merchandising programs, and retail partnerships. Yet many of those initiatives depend on something far more basic: consistent execution inside individual stores.

To better understand the state of convenience retail execution, Survey analyzed observations collected from 18,522 convenience stores across the United States over a 12-month period.
National Convenience Store Benchmark Report highlighting retail execution, pricing accuracy, and out-of-stock trends across 18,522 convenience stores.
National Convenience Benchmark Report based on observations from 18,522 convenience stores nationwide.

Download the Full Benchmark Report

Get exclusive insights from 18,522 convenience stores across the United States.
Download Report

Key Findings at a Glance

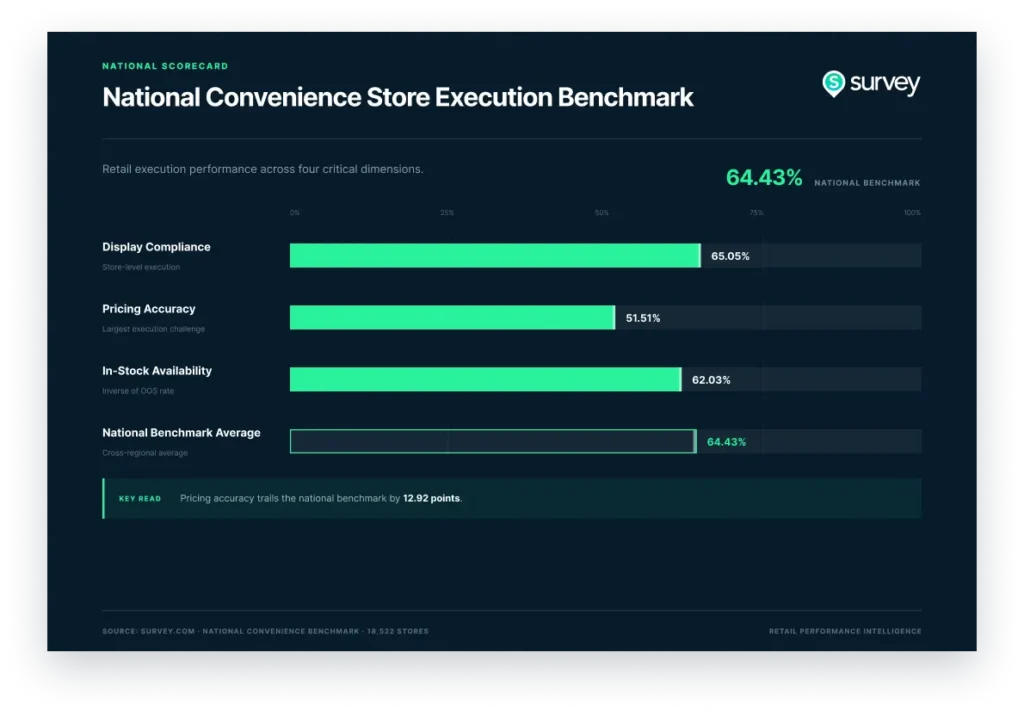
  • 65.05% Display Compliance
  • 51.51% Pricing Accuracy
  • 37.97% Out-of-Stock Rate
  • 64.43% Overall Benchmark Score

National convenience store execution benchmark showing display compliance, pricing accuracy, and in-stock availability.
National Convenience Store Execution Benchmark across four critical retail execution dimensions.

Pricing Accuracy Emerged as the Largest Execution Gap

Of all measures evaluated, pricing accuracy produced the weakest performance. Only 51.51% of observations matched expected or promoted pricing, meaning nearly half of all pricing observations contained a discrepancy.
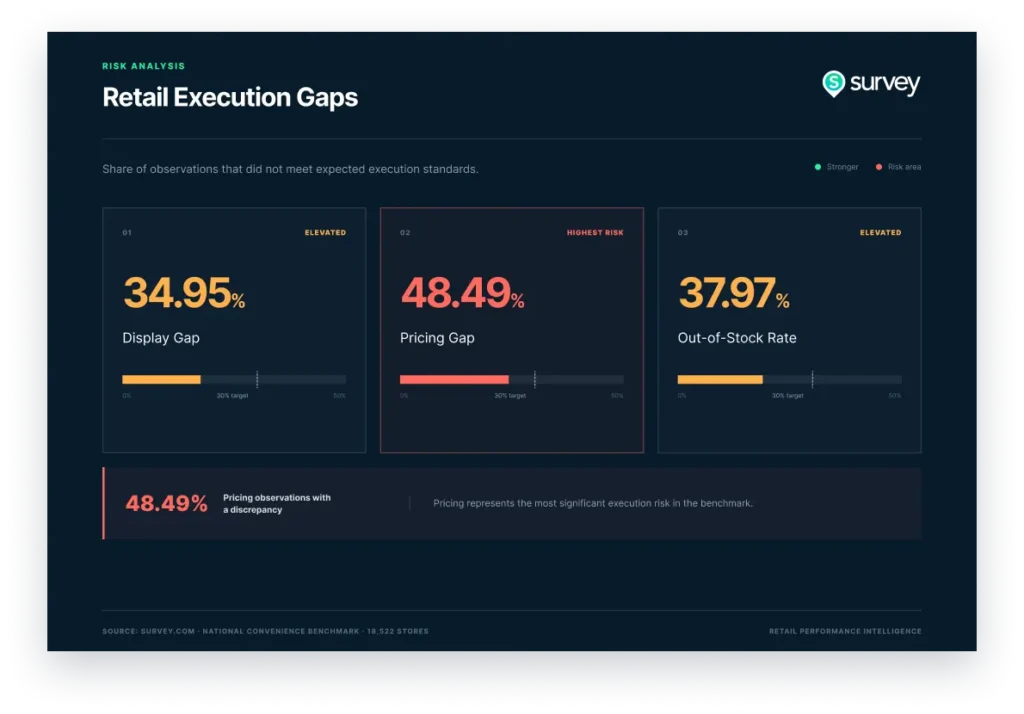
Retail execution gaps benchmark showing pricing discrepancies, display gaps, and out-of-stock rates.
Pricing accuracy emerged as the largest execution challenge observed in the benchmark.

Pricing discrepancies can impact shopper trust, promotional effectiveness, margin performance, and retailer relationships.

Out-of-Stocks Continue to Limit Retail Performance

The benchmark identified an observed 37.97% out-of-stock rate. Every out-of-stock represents a missed opportunity for both brands and retailers.

When products are unavailable, trade investments, promotions, and shopper marketing efforts cannot achieve their intended impact.

Execution Challenges Are National, Not Regional

One of the most surprising findings was the consistency of execution challenges across the United States.

The highest-performing region achieved 66.33%, while the lowest-performing region scored 61.97%, representing only a 4.36-point difference.
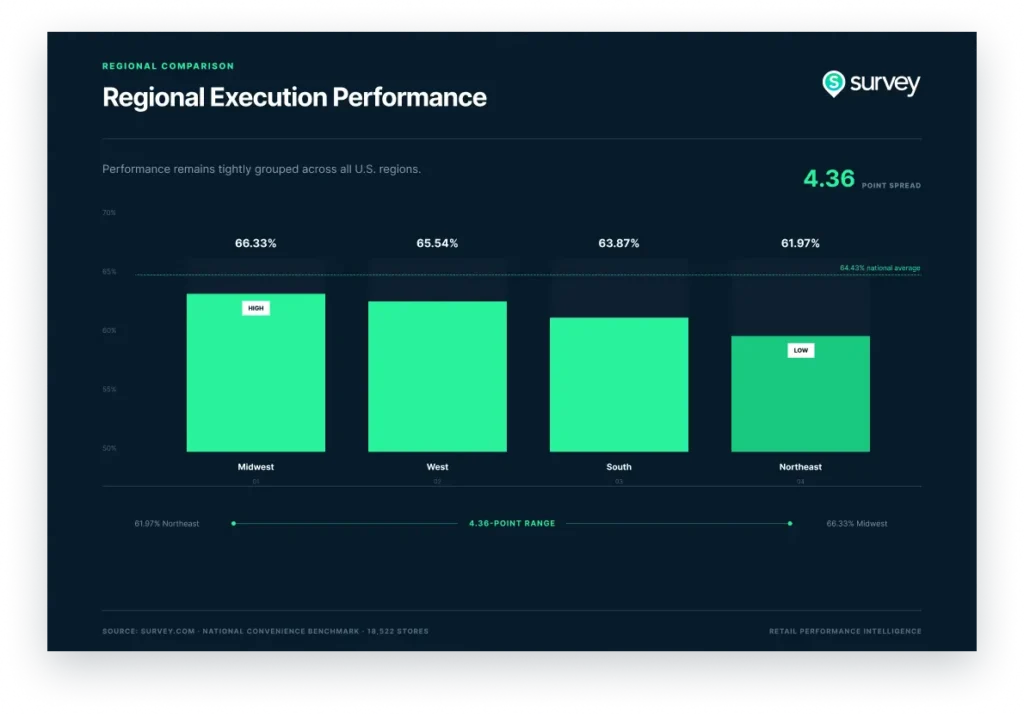
Regional execution performance benchmark comparing Midwest, West, South, and Northeast convenience stores.
Execution challenges appear broadly national rather than isolated to specific regions.

This suggests the opportunity is less about geography and more about improving operational visibility, accountability, and intervention at the store level.

Four Operational Gaps Constraining Retail Performance

The benchmark identified four recurring factors that influence retail performance:
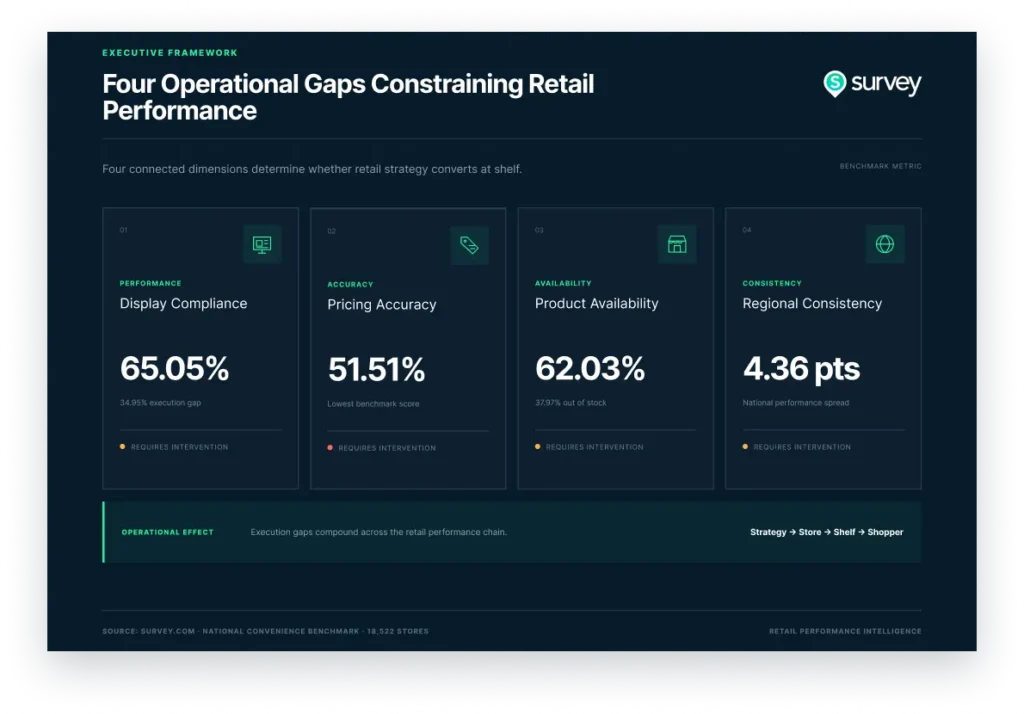
  • Display Compliance
  • Pricing Accuracy
  • Product Availability
  • Regional Consistency

Four operational gaps constraining retail performance including pricing accuracy, display compliance, product availability, and regional consistency.
Display compliance, pricing accuracy, availability, and consistency all influence retail performance.

Turning Retail Intelligence Into Action

The convenience industry doesn’t have a visibility problem. It has an actionability problem.

The most successful organizations connect store-level intelligence with execution, remediation, verification, and continuous optimization.
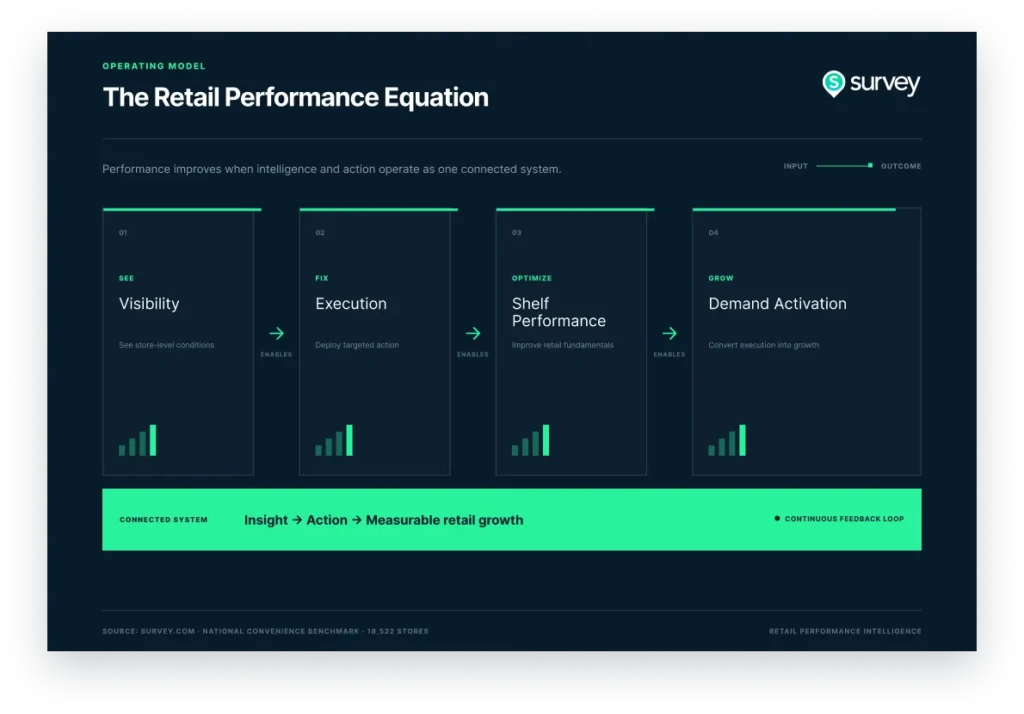
Retail Performance Equation showing visibility, execution, shelf performance, and demand activation.
Retail performance improves when visibility, execution, shelf performance, and demand activation operate as one connected system.

Download the Full National Convenience Benchmark Report

Access the complete research, methodology, regional data, benchmark scores, and recommendations for brands and retailers.

  • 18,522 Convenience Stores Analyzed
  • 12-Month Study Period
  • National Benchmark Metrics
  • Regional Comparisons
  • Strategic Recommendations

Access the complete benchmark report, including methodology, regional performance analysis, pricing accuracy trends, display compliance benchmarks, and strategic recommendations for CPG brands and retailers.

Download the Full Report

Questions about the findings? Contact our team to discuss how Survey helps brands improve retail visibility, execution, shelf performance, and growth.
Summarize with
Related Posts
Request a meeting

Give us some info so the right person can get back to you.

Please enter a valid business email address. Personal emails are not accepted for brand inquiries. If you are a current merchandiser and need support, please visit our Support Center.

By submitting this form, you agree to our Privacy Policy.

Learn

Explore Survey’s latest resources that will make a difference