On-shelf availability doesn’t always mean shoppable 

On-shelf availability doesn’t always mean shoppable 

On-shelf availability doesn’t always mean shoppable 

Most retail execution dashboards report on-shelf availability (OSA) as a single number. But that number doesn’t always reflect what shoppers actually experience in-store. A product can be “in stock” in your system, present on the shelf, and still difficult for shoppers to find or reach. 

If your OSA report says 96% but sales performance tells a different story, the gap may come down to the difference between available and shoppable. 

A simple shelf example 

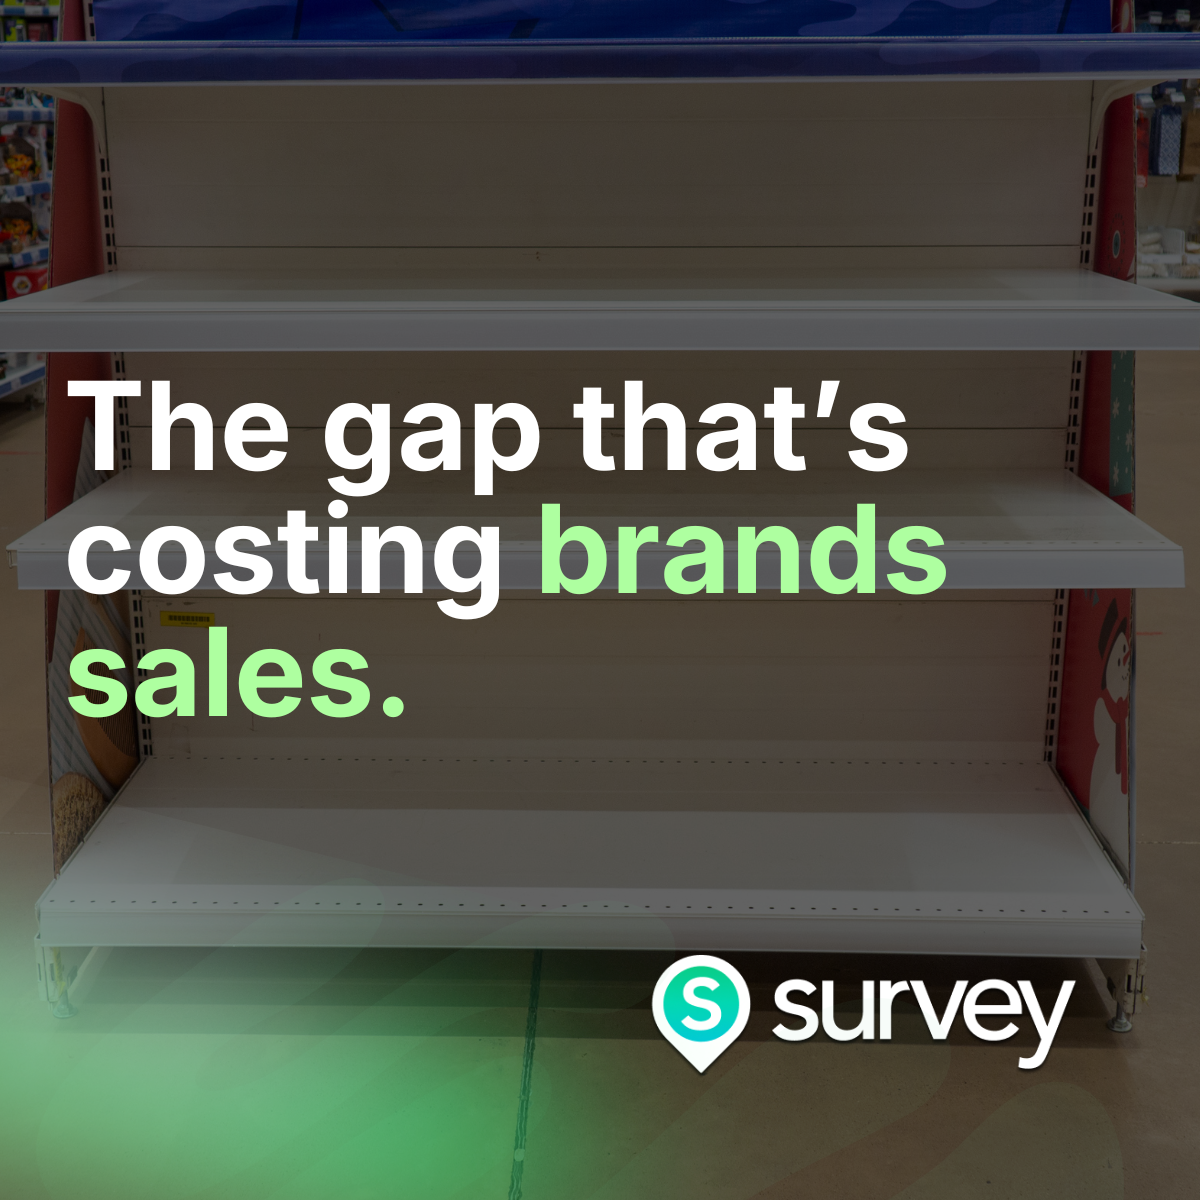
In a recent store visit, low stock wasn’t evenly distributed. Eye-level shelves appeared full, while top and bottom shelves looked nearly empty. 

Looking closer, there were still a few units on the bottom shelf—but pushed all the way to the back, out of sight. 

From a system perspective, the product was in stock. From a shopper’s perspective, it wasn’t meaningfully available. 

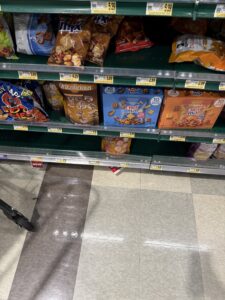
That gap is where missed sales can happen. 

Three types of out-of-stock scenarios 

OSA is meant to represent product availability at the shelf. In practice, there are a few different ways availability can break down: 

  1. True out of stock
    No units on the shelf or in the backroom. This is the most visible issue and typically the easiest to identify.  
  2. Phantom out of stock
    Inventory data and shelf conditions don’t match. The system may show inventory, but the shelf is empty—or vice versa.  
  3. Available but not shoppable
    Products are technically on the shelf, but pushed back, blocked, or outside the shopper’s line of sight.  

Shoppers don’t buy what’s in a system—they buy what they can easily see and reach in the moment. 
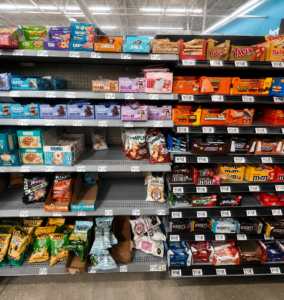
Why shelf position matters 

These issues don’t impact every shelf equally. 

Lower and upper shelves tend to be more vulnerable. Products in these positions are: 

  • Less visible to begin with  
  • More likely to appear out of stock when inventory is low  
  • More affected when items are pushed to the back  

Meanwhile, eye-level shelves can lose some facings and still appear well stocked. 

When OSA is reported as a single number, these differences are often hidden. 

3rd shelf with 1 unit left is still visible shopper, 2nd shelf with 1 unit left is not shoppable 


How to measure what’s actually happening 

Addressing this gap doesn’t require more data—it requires the right data, connected to action. 

A practical approach includes: 

  • Capture shelf-level signals
    Track SKU presence, facings, shelf position, and front vs. back placement. Use photo verification to ground observations in what’s actually happening in-store.  
  • Measure over time
    One visit shows a moment. Repeated visits show patterns—how long issues last, how often they occur, and where they repeat.  
  • Break down by shelf position
    Compare performance across vertical placement to identify where availability breaks down most often.  
  • Profile stores before prioritizing
    Not every store has the same challenges. Segment by store type, volume, location, and execution patterns to focus efforts where they matter most.  
  • Connect to sales and distribution data
    Link shelf conditions to sell-through and distribution to understand which gaps are impacting performance. 


Five ways to improve shelf performance 

  1. Move beyond a single OSA metric
    Break availability down by shelf position, store cluster, and issue type.  
  2. Treat top and bottom shelves as higher risk
    These areas may require more frequent checks and faster correction.  
  3. Track front-of-shelf conditions
    Visibility matters. Products pushed to the back can reduce conversion even when inventory is present.  
  4. Turn insights into action quickly
    Identifying an issue is only the first step—resolving it in-store is what drives impact.  
  5. Prioritize based on impact
    Focus on the stores and SKUs where improving execution will have the greatest effect on sales. 


The takeaway 

On-shelf availability is a useful metric, but it doesn’t always tell the full story. 

Looking at availability through a shopper lens—what’s visible, accessible, and easy to purchase—can help uncover gaps that traditional reporting may miss. 

Those are often the gaps with the biggest opportunity to improve performance.

About the author:
Kelvin So is a Manager, Client Analytic within the Data & Analytics organization at Survey. In this role, Kelvin supports client‑facing analytics work, helping ensure data insights are translated into clear, actionable outcomes for partners.
Related Posts
Request a meeting

Give us some info so the right person can get back to you.

By submitting this form, you acknowledge that your information will be processed by Survey in accordance with our Privacy Policy .

Learn

Explore Survey’s latest resources that will make a difference